
A performance report is a structured document that presents data on the performance of a marketing campaign. It presents information about the brand with the intention of finding out the success or failure of a certain marketing action. It serves to improve the effectiveness of the strategy and optimise it for the future. The data is presented visually and clearly. After this, a series of conclusions are drawn to obtain better results the following month. In digital marketing, strategies must be optimised very frequently. To do this, it is necessary to know how far they have reached, why they have been useful and why they have not. It works on a trial-and-error basis.
Marketing strategies encompass all aspects of the marketing department itself, including advertising campaigns, social media, blogs, newsletters, SEO and SEM. The behaviour of users with the website is decisive for the results report, the conversion rate, clicks or number of visits are metrics that serve to calculate the effectiveness of marketing actions. Making an honest results dashboard measures the value of the work and shows its strengths and weaknesses. Through a useful template, you can make a monthly, quarterly or annual results report.
Objectives of the performance report
- To assess the profitability of the business.
- To understand the performance of the brand.
- To find out which marketing actions generate the best results.
- Optimise sales processes.
- Improve future marketing strategies.
.jpg?width=400&height=301&name=informe_page-0001%20(1).jpg)
what should a performance report look like?
- Rigorous: The document should be based on objective and rigorous information. To this end, it is advisable to cite the sources from which the data is extracted. This gives credibility to your performance report.
- Understandable: The content should be written clearly and concisely. The report should be detailed, but not provide irrelevant information. It is advisable to use sober language to make it suitable for the work environment.
- Structured: The structure of the document should follow a coherent order and be easy for the reader to understand.
- Replicable: The report of results must be replicable for anyone who wishes to contrast the data that appears.
Types of outcome report
There are different types of reports, which are divided according to their characteristics. In general, the treatment given to the information in the document can be of two types:
- Professional report: Also known as an executive report, it is a practical type of report. Its length does not exceed 10 pages and the information is collected in a precise manner.
- Extended report: This is characterised by being longer and going into more detail about the research information.
Depending on the content of the document, reports are divided into the following formats:
- Specialised report: This is also known as a scientific report. Its peculiarity lies in the fact that it uses technical or specialised language. It is aimed at a specific audience.
- Technical report: This is similar to the scientific report, but presents a report from different scenarios to offer a wide range of decisions.
- Informative report: This is aimed at all audiences and aims to provide real brand data to anyone who is interested.
- Mixed report: This is a format that combines specialised language, but tries to be understandable for all audiences, i.e. its content is technical, but the writing is simple.
-4.jpg?width=400&height=274&name=Doc2_page-0001%20(1)-4.jpg)
The intention with which the document is written determines the following classification:
- Expository report: Its intention is purely informative and its objective is to provide information on the current situation of the company to a specific audience.
- Analytical report: It aims to analyse the situation of the brand and to obtain answers about a specific behaviour of the public or marketing action.
- Persuasive report: It tries to convince the reader to take a decision. In other words, it uses the data presented to encourage an action. It usually includes recommendations.
- Interpretative report: Used to analyse brand data and draw useful conclusions for future action.
- Demonstrative report: Its objective is to show the process that has been carried out to achieve certain results.
Metrics involved in the results report
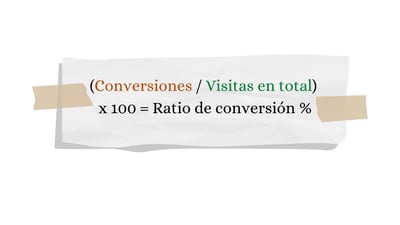
Conversion rate
Shows the percentage of users who have responded to a marketing action. It determines the effectiveness of the content that the brand offers. It is calculated by dividing the number of leads by the number of visits and multiplying the result by 100.
Click-through rate
The click-through rate or CTR is used to determine the performance of a marketing action. If a user clicks on an advertisement or blog post, it means that the strategy is being developed correctly to impact the visitor. The click-through rate is calculated by dividing the clicks by the number of impressions and multiplying the result by one hundred.
Customer acquisition cost
Customer acquisition cost or CAC is used to determine the average cost a brand spends to convert a lead into a customer. It is an indicator that can provide answers on an annual, quarterly or monthly basis. A low CAC will mean that your company is not spending more than it earns.
The first step in calculating the CAC is to add up the costs of the marketing department, sales, employee salaries, overheads, commissions and overheads, then divide the result by the total number of new customers in the same period.
Customer life cycle
Calculating the Life Time Value or LTV and dividing it by the CAC gives the total value of each customer. It indicates the actual cost of acquiring a new customer from the early stages of the cycle until the sale is made. A high LTV is desirable because it will mean that a higher ROI is being generated for the company.
Cost per lead
Knowing how much is invested in each lead helps to determine the efficiency of the marketing effort. It is key to improve the strategy because in order to have a better ROI, the budget invested in the campaign should be recovered. The cost per lead is calculated by dividing the investment of the campaign by the number of leads obtained.
Visits
To understand user behaviour, it is useful to know the total number of visits to the website. This does not determine the percentage of sales, but it is useful to know which pages receive more traffic. Similarly, the bounce rate helps to know how many users leave the website after arriving.
6 steps to a performance report
1. Calculate the performance of your marketing actions
The first step to a performance report is to know the reach of a marketing action and whether the content is working properly. It is a good idea to update your metrics on a regular basis.
There is the total reach that refers to the total number of prospects or people that the brand can contact. On the other hand, the reach by channel finds out how many people follow the brand or are subscribed to each social network or communication channel. A monthly growth template is used to automatically calculate the total sum.
2. Calculate the visits to your website
Knowing the total visits to your website helps to determine the success of your marketing actions. Higher web traffic increases the number of potential customers and brand recognition. This data can be represented with monthly templates or graphs.
3. Calculate the sales opportunity
Sales achieved is used to calculate your company's ROI, but sales opportunity calculates how much revenue your brand generates in relation to the number of potential customers. This helps you to understand the value of your web traffic and to find out which channels are most useful for making a profit.
4. Calculate the conversion rate
The conversion rate indicates the quality of content. It should be calculated to determine if strategies are working properly. It includes monthly information on visitors, sales and total conversions. Knowing the impact of a marketing action helps to pinpoint areas for improvement.
 5. Sorting the information
When the objective of the report is determined and the necessary data is obtained, a content outline should be developed. It should be simple and understandable for any reader.
6. Present the results and conclusions
Presenting the results correctly determines the scope of the results report. It is advisable to combine different presentation formats to show the conclusions and findings of the research. Presenting the results visually with scales, bars or graphs facilitates their analysis and understanding. Finally, a summary of the report should be drawn up that brings together the most relevant points.
Tools for reporting results
It is used to gather the company's metrics in one place, including SEO, social media and PPC analytics, among others.
HubSpot's marketing software offers access to templates for performance reporting, tools for automated calculations and integration with any metric in a marketing strategy, and connects with Google Analytics to simplify analytics..jpg?width=400&height=292&name=informe%20hubspot_page-0001%20(1).jpg) Google Data Studio
Google Data Studio
This is a customised tool that offers templates for reporting, a large gallery with real examples and connects to Google's data sources.